Visualizing 3D Flow with Volume Line Integral Convolution
While at working as a staff scientist at ICASE, I investigated strategies
for more effectively using 3D Line Integral Convolution to portray 3D flow.
Parts of this work are described in the following papers:
Strategies for Effectively Visualizing 3D Flow with Volume LIC,
Victoria Interrante and Chester Grosch (1997) IEEE Visualization '97, pp. 421-424.
[PDF]
[abstract]
����This paper discusses strategies for effectively portraying 3D flow using volume line integral convolution. Issues include defining an appropriate input texture, clarifying the distinct identities and relative depths of the advected texture elements, and selectively highlighting regions of interest in both the input and output volumes. Apart from offering insights into the greater potential of 3D LIC as a method for effectively representing flow in a volume, a principal contribution of this work is the suggestion of a technique for generating and rendering 3D visibility- impeding ęhalosė that can help to intuitively indicate the presence of depth discontinuities between contiguous elements in a projection and thereby clarify the 3D spatial organization of elements in the flow. The proposed techniques are applied to the visualization of a hot, supersonic, laminar jet exiting into a colder, subsonic coflow.
��Visualizing 3D Flow, Victoria Interrante and Chester Grosch (1998),
IEEE Computer Graphics and Applications, 18(4), pp. 49-53.
[PDF]
[abstract]
�
We discuss some factors that may underlie some of the perceptual difficulties encountered with dense 3D displays and describe strategies for more effectively visualizing 3D flow with volume LIC. Specifically, we suggest techniques for: selectively emphasizing critical regions of interest in a flow; facilitating the accurate perception of the 3D depth and orientation of overlapping streamlines; efficiently incorporating an indication of orientation into a flow representation; and conveying additional information about related scalar quantities such as temperature or vorticity over a flow via subtle, continuous line width and color variations.
�
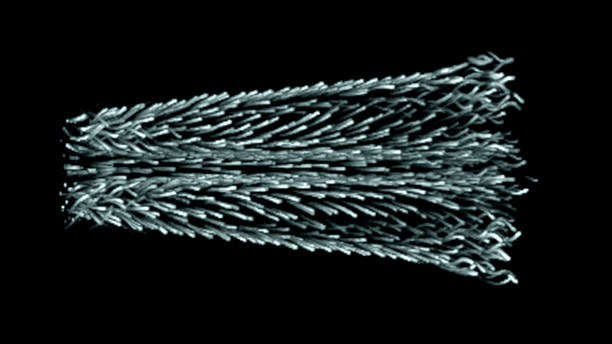
The images below highlight more of my results.
The flow data, generated by
Dr. Chester
Grosch, represents a numerical
simulation of a hot, supersonic, laminar jet exiting into a colder, subsonic
coflow.
It is important to let the flow define the visible surface.
You can click inside the rightmost pair of images above to see mpeg animations
through the slices in the 3D volume.
These side-by-side comparison images show how the use of
smoothly continuous, 3D visibility-impeding halos can clarify the
presentation of the flow information. Clicking on these images brings
up mpeg animations.
A simple modification of the
fast-LIC
algorithm by Detlev Stalling and Hans-Christian Hege
allows the efficient computation of oriented 3D LIC images.
This work was inspired by the example of
OLIC,
an oriented LIC method developed by Rainer Wegenkittl, Eduard GrÜller and Werner Purgathofer in 1997.
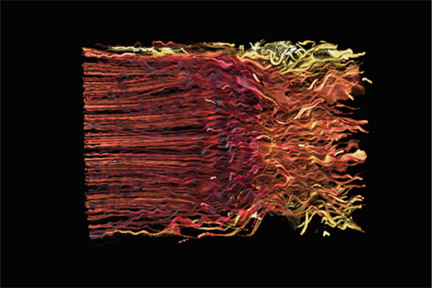
Color remains one of the best means of conveying information about related
scalar quantities over a volume rendered flow. In the image above, color
varies from red to yellow with increasing temperature, highlighting the
effects of friction across the boundary layers in this flow.
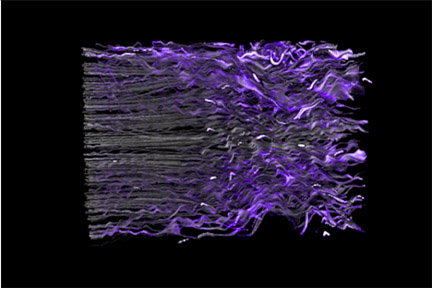
Saturation increases with increasing streamwise vorticity across the
same set of streamlines in this image, subtly emphasizing the areas
of greatest turbulence. Both of these flows are rendered using halos.
In this image, color is used as an additional variable to represent the
magnitude of the vorticity across the flow volume.
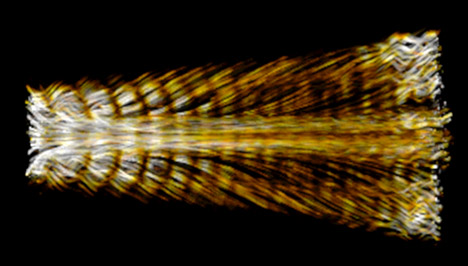
This particular visualization conveys the pressure waves that are being
propagated down the axis of the flow. Halos are not being used.